Structural
The structural collection includes results-based financing indicators that measure facility management, such as availability of physical and human resources, physical accessibility of health services, the existence of facility systems, and the capacity of the workforce to provide services.
The RBF Indicator Compendium has three other collections: quality of services, service use and intervention coverage, and health outcomes and impact.
Service-specific readiness score for health facilities
Definition: Cumulative availability of components required in health facilities to deliver specific services, expressed as percentage. The overall score for a specific service is the unweighted average of number of items present and functioning, expressed as a percentage of the total number of items in that service.
Numerator: Number of facilities that offer and meet tracer criteria for specific services:
- Family planning services
- Antenatal care services
- Basic emergency obstetric and newborn care
- Comprehensive Emergency Obstetric Care (CEmO)
- Child health services (routine child immunization)
- Child health services (curative care and preventive services including growth monitoring)
- HIV counseling and testing
- HIV/AIDS care and support services
- HIV/AIDS antiretroviral prescription and client management
- Preventing mother-to-child transmission (PMTCT) services
- Tuberculosis services
- Malaria services (if relevant)
- Chronic Diseases adult treatment and preventive services
- Minor surgery services
Denominator: Total number of health facilities and total number of facilities offering specific services.
Disaggregation: Facility type, managing authority.
Scores for the different domains of general service readiness should be presented separately. All scores can be presented by district and by ownership of facilities.
Hospitals provide a wide range of services and an expanded version of the questionnaire should be administered during facility assessment, or regular reporting.
Data Requirements: Data collected using a standardized questionnaire to assess the availability and functioning of the tracer items in each service provided. These data can be used to calculate scores for each domain.
See also: Percent of facilities prepared to provide the essential services; Service Availability and Readiness Assessment (SARA)
Data Sources: Health facility assessments (using a standardized questionnaire to assess the availability and functioning of the tracer items in each service provided).
Purpose: Service-specific readiness refers to the capacity of health facilities to provide a specific service, measured through the presence of tracer items that include trained staff, guidelines, equipment/supplies, diagnostic capacity, medicines and commodities.The main challenge is to develop a concise set of items for each domain so that all programmes can be monitored through a single data collection mechanism. Recommended tracer items to monitor readiness to deliver specific services are presented in (WHO 2010; Table 1.A.2). http://www.who.int/healthinfo/systems/WHO_MBHSS_2010_full_web.pdf
Issue(s): Definitions and data collection should be standardized.
References: World Health Organization (WHO). Monitoring the Building Blocks of Health Systems: A Handbook of Indicators and Their Measurement Strategies.; 2010.
Further information and related links
Framework of actions for the follow-up to the Programme of Action of the International Conference on Population and Development beyond 2014. Report of the Secretary-General. New York (NY): United Nations; 2014 (Retrieved from https://www.unfpa.org/webdav/site/global/shared/documents/ICPD/Framework%20of%20action%20for%20the%20follow-up%20to%20the%20PoA%20of%20the%20ICPD.pdf ).
Monitoring the building blocks of health systems: a handbook of indicators and their measurement strategies. Geneva: World Health Organization; 2010 (Retrieved from http://www.who.int/healthinfo/systems/WHO_MBHSS_2010_full_web.pdf?ua=1)
PEPFAR. Next Generation Indicators Reference Guide - Planning and Reporting. Version 1.2. The President’s Emergency Plan for AIDS Relief, Feb. 2013.( Retrieved from http://www.pepfar.gov/documents/organization/81097.pdf).
Availability of essential medicines and commodities
Definition: Percent of health facilities with essential medicines and life-saving commodities.
Numerator: Number of facilities with essential medicines in stock.
Denominator: Total number of health facilities.
Disaggregation: Facility type, facility managing authority (public/private), specific type of medicine/commodity (e.g. priority medicines for women and children, vaccines, antiretroviral therapy (ART), family planning, essential noncommunicable disease (NCD) medicines).
WHO-recommended essential core list of medicines: bronchodilator inhaler, steroid inhaler, glibenclamide, metformin, insulin, angiotensinconverting-enzyme (ACE) inhibitor, calcium channel blocker, statin, aspirin, thiazide diuretic, beta-blocker, omeprazole tablet, diazepam injection, fluoxetine tablet, haloperidol tablet, carbamazepine tablet, amoxicillin tablet/capsule, amoxicillin suspension, ampicillin injection, ceftriaxone injection, gentamicin injection, oral rehydration salts, zinc sulfate.
Essential NCD medicines: at least aspirin, a statin, an ACE inhibitor, thiazide diuretic, a long-acting calcium channel blocker, metformin, insulin, a bronchodilator and a steroid inhalant.
Priority medicines for women and children: amoxicillin tablet/capsule, amoxicillin suspension, ampicillin injection, ceftriaxone injection, gentamicin injection, oral rehydration salts, zinc sulphate, oxytocin injection, magnesium sulphate injection.
Suggested core list of medicines for pricing/affordability surveys: Salbutamol inhaler 100 mcg per dose (200 doses); beclometasone inhaler 100 mcg/dose (200 doses); glibenclamide 5 mg tablet; metformin 500 mg tablet; insulin regular 100 IU/ml, 10 ml vial; enalapril 5 mg tablet; amlodipine 5 mg tablet; simvastatin 20 mg tablet; aspirin 100 mg tablet; hydrochlorothiazide 25 mg tablet; carvedilol 12.5 mg tablet; omeprazole 20 mg tablet; diazepam 10 mg/2 ml injection; fluoxetine 20 mg tablet; haloperidol 5 mg tablet; carbamazepine 200 mg tablet; amoxicillin 500 mg capsule/tablet; amoxicillin 250 mg/5 ml suspension; ampicillin 500 mg injection; ceftriaxone 1 G vial; gentamicin 80 mg/2 ml injection; oral rehydration salts (sachet for 1 litre); zinc sulfate 2 0mg tablet; oxytocin injection (5 or 10 iu); magnesium sulfate 50% injection 10 ml vial.
Data Requirements: Stock out data may also refer to specific time period (1 month, 3 months).
Data on the availability of a specific list of medicines are collected from a survey of a sample of facilities. Availability is reported as the percentage of medicine outlets where a particular medicine was found on the day of the survey. Health facility reports may also include stockouts indicators but require regular independent verification.
See also:Service Availability and Readiness Assessment (SARA); Average availability of 14 selected essential medicines in public and private health facilities
Data Sources: Special facility surveys
Routine facility information systems
Purpose: Essential medicines refer to those medicines that satisfy the priority health care needs of the population. They are intended to be available within the context of functioning health systems at all times, in adequate amounts, in the appropriate dosage, with assured quality, and at a price that individuals and the community can afford.
WHO and Health Action International (HAI) have developed a standardized methodology for facility-based surveys of medicine prices, availability, affordability and price components, collecting data on the availability and price of approximately 50 medicines, through visits to medicines outlets in the public sector, private sector and any other sectors that serve as important medicine dispensing points (e.g. NGOs, mission hospitals). The list of survey medicines includes 14 medicines in use worldwide as well as 16 regionally specific medicines, with recommendations for countries to collect data on a further 20 medicines of national importance.
Issue(s): Access has been defined as “having medicines continuously available and affordable at public or private health facilities or medicine outlets that are within one hour’s walk of the population”. Given its complexity, an overall picture of access to medicines can only be generated using a range of indicators that provide data on medicine availability and price, in both public and private sectors, in combination with key policy indicators.
In addition to the availability (and price) of medicines, it is also important to assess the quality of use aspects, such as appropriate prescription practices, rational medicine use and user adherence. This requires a more extensive assessment of practices in facilities, including record reviews, exit interviews and observation of patients and providers.
References: World Health Organization (WHO). Monitoring the Building Blocks of Health Systems: A Handbook of Indicators and Their Measurement Strategies.; 2010. http://www.who.int/healthinfo/systems/WHO_MBHSS_2010_full_web.pdf
World Health Organization (WHO). 2015 Global Reference List of 100 Core Health Indicators.; 2015. http://apps.who.int/iris/bitstream/10665/173589/1/WHO_HIS_HSI_2015.3_eng.pdf
World Health Organization. Monitoring, Evaluation, and Review of National Health Strategies: A Country-Led Platform for Information and Accountability.; 2011. http://www.who.int/healthinfo/country_monitoring_evaluation/1085_IER_131011_web.pdf
Further information and related links
Draft comprehensive global monitoring framework and targets for the prevention and control of noncommunicable diseases, including a set of indicators. Agenda item A66/8, Sixty-sixth World Health Assembly, 20–28 May 2013. Geneva: World Health Organization; 2013 (Retrieved from http://apps.who.int/gb/ebwha/pdf_files/WHA66/A66_8-en.pdf?ua=1 ).
Indicators for monitoring the Millennium Development Goals: definitions, rationale, concepts and sources. New York (NY): United Nations; 2012 (Retrieved from http://mdgs.un.org/unsd/mi/wiki/MainPage.ashx ).
Monitoring the building blocks of health systems: a handbook of indicators and their measurement strategies. Geneva: World Health Organization; 2010 (Retrieved from http://www.who.int/healthinfo/systems/WHO_MBHSS_2010_full_web.pdf?ua=1).
Framework of actions for the follow-up to the Programme of Action of the International Conference on Population and Development beyond 2014. Report of the Secretary-General. New York (NY): United Nations; 2014 (Retrieved from https://www.unfpa.org/webdav/site/global/shared/documents/ICPD/Framework%20of%20action%20for%20the%20follow-up%20to%20the%20PoA%20of%20the%20ICPD.pdf).
Percent of health facilities with soap and running water or alcohol-based rub available in labour, childbirth, neonatal and paediatric wards
Definition: Percent of health facilities with soap and running water or alcohol-based rub available in labour, childbirth, neonatal and paediatric wards
Numerator: Number of health facilities with soap and running water or alcohol-based rub available in labour, childbirth, neonatal and paediatric wards.
Denominator: Total number of health facilities
Disaggregation: Facility or ward type, geographic location, managing authority, programme.
Data Requirements: Record of direct observation of the facility infrastructure and commodities (soap, running water, alcohol-based rub.)
Data Sources: Service availability and readiness assessment (SARA)
Other health facility surveys
Self-report
Purpose: This indicator measures the availability of physical resources at the facility. Access to soap and running water or alcohol-based rub are necessary for basic infection control and are intended to be available within the context of functioning health systems at all times and in adequate amounts.
References: World Health Organization (WHO). Consultation on Improving Measurement of the Quality of Maternal, Newborn and Child Care in Health Facilities.; 2013. http://apps.who.int/iris/bitstream/10665/128206/1/9789241507417_eng.pdf
Percent of health facilities equipped with the medications and supplies necessary to provide evidence-based essential maternal health care
Definition: Percent of health facilities equipped with the medications and supplies necessary to provide evidence-based essential maternal health care.
Numerator: Number of facilities that have iron and folic acid tablets, syphilis test kits in the antenatal clinic or hospital.
Denominator: All health facilities providing antenatal care.
Disaggregation: Commodity type, facility type, geographic location, managing authority, programme.
Data Requirements: Stock out data may also refer to specific time period (1 month, 3 months).
Data on the availability of iron, folic acid, and syphilis tests are collected from a survey of facilities. Availability is reported as the percentage of medicine outlets where a particular medicine was found on the day of the survey. Health facility reports may also include stockouts indicators but require regular independent verification.
Data Sources: Health facility survey
SARA (service availability and readiness assessment)
SPA (service provision assessment)
Routine logistic information system
Purpose: This indicator measures the availability of physical resources at the facility. Access to iron, folic acid, and syphilis tests and are intended to be available within the context of functioning antenatal clinics at all times and in adequate amounts.
References: World Health Organization (WHO). Consultation on Improving Measurement of the Quality of Maternal, Newborn and Child Care in Health Facilities.; 2013. http://apps.who.int/iris/bitstream/10665/128206/1/9789241507417_eng.pdf
Percent of health facilities equipped with the medications and supplies necessary to provide evidence-based emergency obstetric care
Definition: Percent of health facilities equipped with the medications and supplies necessary to provide evidence-based emergency obstetric care.
Numerator: Number of facilities that have oxytocin and magnesium sulfate in the labour and delivery ward.
Denominator: All health facilities providing maternity care.
Disaggregation: Commodity type, geographic location, managing authority, programme.
Data Requirements: Stock out data may also refer to specific time period (1 month, 3 months).
Data on the availability of oxytocin and magnesium sulfate collected from a survey of facilities. Availability is reported as the percentage of medicine outlets where a particular medicine was found on the day of the survey. Health facility reports may also include stockouts indicators but require regular independent verification.
See also:Number of facilities per 500,00 providing basic and comprehensive emergency obstetric care
Data Sources: Health facility survey
SARA (service availability and readiness assessment)
SPA (service provision assessment)
Routine logistic information system
Purpose: This indicator measures the availability of physical resources at the facility. Access to oxytocin and magnesium sulfate are intended to be available within the context of functioning labor and delivery wards at all times and in adequate amounts.
References: World Health Organization (WHO). Consultation on Improving Measurement of the Quality of Maternal, Newborn and Child Care in Health Facilities.; 2013. http://apps.who.int/iris/bitstream/10665/128206/1/9789241507417_eng.pdf
Percent of health facilities in which gentamicin is available at suitable peripheral level for neonatal sepsis
Definition: Percent of health facilities in which gentamicin is available at suitable peripheral level for neonatal sepsis.
Numerator: Number of facilities with injectable gentamicin.
Denominator: All facilities providing maternity services.
Disaggregation: Facility type, geographic location, managing authority, programme.
Data Requirements: Stock out data may also refer to specific time period (1 month, 3 months).
Data on the availability of injectable gentamicin are collected from a survey of facilities. Availability is reported as the percentage of medicine outlets where a particular medicine was found on the day of the survey. Health facility reports may also include stockouts indicators but require regular independent verification.
Data Sources: Health facility survey
SARA (service availability and readiness assessment)
SPA (service provision assessment)
Routine logistic information system
Purpose: This indicator measures the availability of physical resources at the facility. Access to injectable gentamicin and are intended to be available within the context of functioning maternity and pediatric facilities at all times and in adequate amounts.
References: World Health Organization (WHO). Consultation on Improving Measurement of the Quality of Maternal, Newborn and Child Care in Health Facilities.; 2013. http://apps.who.int/iris/bitstream/10665/128206/1/9789241507417_eng.pdf
Percent of health facilities with bags and masks (neonatal mask size) in labour and delivery wards
Definition: Percent of health facilities with bags and masks (neonatal mask size) in labour and delivery wards.
Numerator: Number of facilities with neonatal bags and masks in the labour and delivery ward.
Denominator: All facilities providing maternity services.
Disaggregation: Commodity type, facility type, geographic location, managing authority, programme.
Data Requirements: Stock out data may also refer to specific time period (1 month, 3 months).
Data on the availability of neonatal sized bags and masks are collected from a survey of facilities. Availability is reported as the percentage of medicine outlets where a particular medicine was found on the day of the survey. Health facility reports may also include stockouts indicators but require regular independent verification.
Data Sources: Health facility survey
SARA (service availability and readiness assessment)
SPA (service provision assessment)
Routine logistic information system
Purpose: This indicator measures the availability of physical resources at the facility. Access to neonatal sized bags and masks and are intended to be available within the context of functioning maternity and pediatric facilities at all times and in adequate amounts.
References: World Health Organization (WHO). Consultation on Improving Measurement of the Quality of Maternal, Newborn and Child Care in Health Facilities.; 2013. http://apps.who.int/iris/bitstream/10665/128206/1/9789241507417_eng.pdf
Percent of health facilities that had stock-outs of essential lifesaving medicines for mothers, newborns and children in a specified period
Definition: Percent of health facilities that had stock-outs of essential lifesaving medicines for mothers, newborns and children in a specified period
Numerator: Number of health facilities that had stock-outs of essential lifesaving medicines for mothers (oxytocin, magnesium sulfate, dexamethasone, oral amoxicillin, injectable gentamicin (context-specific malaria rapid diagnostic tests, antimalarial and antiretroviral agents)), newborns and children (vaccines, oral rehydration salt, zinc, oral amoxicillin, injectable gentamicin (context-specific malaria rapid diagnostic tests, antimalarial and antiretroviral agents in a specified period))
Denominator: Total number of health facilities.
Disaggregation: Facility type, managing authority, specific type of medicine/commodity (e.g. priority medicines for women and children, mothers, newborns)
Data Requirements: Stock out data may also refer to specific time period (1 month, 3 months).
Use of out-of-stock cards and direct observation to collect data through survey or routine information systems. Availability is reported as the percentage of medicine outlets where a particular medicine was found on the day of the survey. Health facility reports may also include stockouts indicators but require regular independent verification.
See also: Percent of facilities that experienced a stockout at any point during a given time period
Data Sources: Health facility survey
Essential drugs survey
SARA (service availability and readiness assessment)
SPA (service provision assessment)
Routine logistic information system
Purpose: This indicator measures the availability of physical resources at the facility. Access to 16 (possible) essential medicines for mothers and children are intended to be available within the context of functioning health systems at all times and in adequate amounts.
Issue(s): If it is not necessary or feasible to collect information on several essential medicines, other indicators on more specific essential medicines are available.
References: World Health Organization (WHO). Consultation on Improving Measurement of the Quality of Maternal, Newborn and Child Care in Health Facilities.; 2013. http://apps.who.int/iris/bitstream/10665/128206/1/9789241507417_eng.pdf
World Health Organization (WHO). 2015 Global Reference List of 100 Core Health Indicators.; 2015. http://apps.who.int/iris/bitstream/10665/173589/1/WHO_HIS_HSI_2015.3_eng.pdf
Percent of health facilities with uninterrupted stocks of vaccines, oral rehydration salts, zinc, antimalarial and antiretroviral agents and injectable gentamicin in the past 3 months
Definition: Percent of health facilities with uninterrupted stocks of vaccines, oral rehydration salts, zinc, antimalarial and antiretroviral agents and injectable gentamicin in the past 3 months.
Numerator: Number of facilities with stocks of vaccines, oral rehydration salts, zinc, antimalarial and antiretroviral agents and injectable gentamicin in the past 3 months.
Denominator: All facilities providing child health services.
Disaggregation: Commodity type, facility type, geographic location, managing authority, programme.
Data Requirements: Stock out data may also refer to other specific time periods (1 month, 3 months).
Data on the availability of vaccines, oral rehydration salts, zinc, antimalarial and antiretroviral agents and injectable gentamicinare collected from a survey of facilities. Availability is reported as the percentage of medicine outlets where a particular medicine was found on the day of the survey. Health facility reports may also include stockouts indicators but require regular independent verification.
Data Sources: Health facility survey
SARA (service availability and readiness assessment)
SPA (service provision assessment)
Routine logistic information system
Purpose: This indicator measures the availability of physical resources at the facility. Access to vaccines, oral rehydration salts, zinc, antimalarial and antiretroviral agents and injectable gentamicin and are intended to be available within the context of functioning health system at all times and in adequate amounts.
References: World Health Organization (WHO). Consultation on Improving Measurement of the Quality of Maternal, Newborn and Child Care in Health Facilities.; 2013. http://apps.who.int/iris/bitstream/10665/128206/1/9789241507417_eng.pdf
Percent of health facilities with safe, uninterrupted oxygen supply in childbirth, neonatal and paediatric wards
Definition: Percent of health facilities with safe, uninterrupted oxygen supply in childbirth, neonatal and paediatric wards
Numerator: Number of health facilities with safe, uninterrupted oxygen supply in childbirth, neonatal and paediatric wards
Denominator: Total number of health facilities.
Disaggregation: Ward or facility type, geographic location, managing authority, programme.
Data Requirements: Stock out data may also refer to specific time period (1 month, 3 months).
Data on the availability of oxygen are collected from a survey of facilities. Availability is reported as the percentage of medicine outlets where a particular medicine was found on the day of the survey. Health facility reports may also include stockouts indicators but require regular independent verification.
Data Sources: Health facility survey
SARA (service availability and readiness assessment)
SPA (service provision assessment)
Routine logistic information system
Purpose: This indicator measures the availability of physical resources at the facility. Access to oxygen in labor and delivery, neonatal, and pediatic wards is intended to be available within the context of functioning health facility at all times and in adequate amounts.
References: World Health Organization (WHO). Consultation on Improving Measurement of the Quality of Maternal, Newborn and Child Care in Health Facilities.; 2013. http://apps.who.int/iris/bitstream/10665/128206/1/9789241507417_eng.pdf
Percent of facilities whose stock levels ensure near-term product availability
Definition: This indicator measures the percent of facilities with stock levels greater than zero and below the established maximum level for each full-supply method/brand/product of interest at a point in time (e.g., the day of visit). Where stock levels are greater than zero but below the established minimum level, evaluators must find an outstanding order for replacement stock, made at or before the time stock levels reached minimum.
This indicator is calculated as:
(Number of facilities that have stock levels above zero but below the established maximum level for the product / Total number of facilities reviewed) x 100
Evaluators can report the indicator at the facility level or aggregate it for a sample of facilities or for the entire program. At any level, evaluators should calculate and report the indicator separately for each product of interest so that each product receives a unique measure. If so desired, evaluators can further aggregate to construct additional indicators, such as the percent of facilities with all full-supply products adequately stocked. Averaging all products for an "average" stock level adequacy is not recommended, because oversupply in one product can cancel out undersupply in another, and thus falsely imply that average stock levels were adequate.
Data Requirements: Stock levels of all products of interest at a point in time (e.g., the day of the visit); maximum and minimum stock levels established by the program; historical consumption or issues data for each product at each facility; and records of recent orders (for products below minimum levels).
If targeting and/or linking to inequity, stratify survey sample by location (poor/not poor) and disaggregate by location.
Data Sources: A facility survey/logistics site visit - to all facilities or to a representative sample - is frequently necessary to assess stock levels. Evaluators may collect stock data by taking a physical inventory or by reviewing the stock ledger or stock cards. In some countries/ programs, the logistics management information system (LMIS) or supervisory/ staff records may provide usable stock-level data. The LMIS should also provide maximum and minimum stock levels along with consumption data by product. Service statistics or similar records may provide the needed data on consumption or issues if the LMIS does not.
Purpose: This indicator provides an overall measure of whether stock levels of products are adequate at a point in time. It helps reveal overstock situations that could lead to product expiration and wastage, and low stock levels that could result in stockouts or rationing. In applying this indicator, evaluators must carefully evaluate facilities where stock quantities are below established minimum levels. To do so, the evaluator should determine whether a new order was placed when stock levels reached minimum. If such an order is outstanding, then the evaluator may consider stock status adequate, because the order will likely arrive before the facility stocks out. If not, the stock status is inadequate.
Issue(s): Evaluators should apply the indicator only to products the program has committed to keeping in full supply, because stock status at a point in time for non-full-supply products may reflect only the length of time since the last shipment arrived rather than measuring whether inventory management procedures are effective. Ideally, evaluators will measure stock status over a period of time, but this approach is usually possible only where the LMIS is automated.
Occurrence of stockouts for any contraceptive or other identified reproductive health commodity at the central-level warehouse during a specified time period
Definition: This indicator measures the number of stockouts of any contraceptive or other identified reproductive health (RH) commodity that the central-level warehouse is expected to provide, at any point, within a defined period of time (for example, the past six or 12 months). Occurrence of stockouts can be calculated for a single product or aggregated for all products carried by the central-level warehouse. It can also be measured over any time period, however one year is typically used.
Data Requirements: Verification of stockouts of each contraceptive or RH commodity at the central-level warehouse (during specified amount of time).
If targeting and/or linking to inequity, stratify survey sample by location (poor/not poor) and disaggregate by location.
Data Sources: Site visits (physical inventories); logistics management information system (LMIS) records; program manager or facility stock manager interviews; list of products that the central-level warehouse was committed to supplying (to determine if rationing of supplies occurred)
Purpose: This indicator measures the efficiency and preparedness of health systems. It serves as a proxy for the overall ability of country facilities and programs to meet clients’ family planning/RH needs with a full range of products and services. With better forecasting and less waste of contraceptive and RH commodities, the occurrence of stockouts decreases over time and access – measured in terms of availability – improves.
Issue(s): In order for this indicator to be accurate, LMIS and stock records must be available and maintained regularly. It is also important to check stock records with what was “planned to be stocked,” to ensure that facilities are not rationing supplies in order to avoid stockouts. In the case of rationing, this indicator may under-represent the number of stockouts that would have occurred if the warehouse had been following its original commodity stocking plan.
References: Aronovich D, Tien M, Collins E, Sommerlatte A, Allain L. 2010. Measuring Supply Chain Performance: Guide to Key Performance Indicators for Public Health Managers. Arlington, Va: USAID | DELIVER PROJECT, Task Order 1.
Condom availability for young people (15-24)
Definition: The percent of randomly selected sites and venues typically accessed by young men and women aged 15-24 years which have condoms in stock at the time of the survey.
Sites and venues that are typically accessed by young people must be operationally defined through key informant interviews or responses on a youth survey to questions on where young people get condoms or where they prefer to get them. These venues should primarily include retail outlets, youth centers, health clinics, school clinics, and pharmacies. Additional sites could be as diverse as bus stops, barbers’ shops, hair salons, night clubs, bars, food shops, kiosks, markets, petrol stations, and other community-based distributors.
This indicator is calculated as:
(Number of retail outlets and service delivery points that are typically accessed by young people aged 15-24 years that have condoms in stock at the time of the survey / Number of retail outlets and service delivery points typically accessed by young people) x 100
Data Requirements: Inventories, responses to surveys that demonstrate condom availability. The sampling frame should be stratified in order to ensure geographical, demographic, and socioeconomic diversity (e.g. rural/urban). It is better to limit the type of venue that could or should provide condoms to young people, and to focus on a defined set that must consistently provide them. Accordingly, this indicator should focus mainly on the priority venues and include additional ones as resources permit.
The data can be disaggregated by condom type (male/female), geographical location (e.g. region, state, district, county or ward), outlet type and if the condoms were available behind the counter or available where people did not need to ask for them. Data disaggregated by outlet type provide invaluable information for program managers and for persons seeking to improve the marketing of condoms.
Data Sources: Condom inventories and purchase records for sites and venues, or the MEASURE Evaluation/WHO/ PSI compiled condom availability and quality protocol retail survey.
Purpose: This indicator helps measure the supply and accessibility of condoms for young people by monitoring the distribution of condoms at venues where youth will typically access them. It highlights programs and efforts to increase the distribution of condoms so they are available at the types of locations young people prefer. Because of the stigma around adolescent sexual activity many young people do not feel comfortable purchasing condoms in places where they know people or fear judgment.
While condom availability is considered important component of a program aimed at increasing access and usage there is no clear link to between condom availability alone and their subsequent usage, particularly by young people (WHO, 2004). Thus, combining this indicator with other indicators such as Percent of sexually active, unmarried adolescents who consistently use condoms can give a powerful picture of the adequacy of condom provision.
Issue(s): This indicator does not measure cost or if condoms are available at the right time. However, barriers to accessibility other than simple absence of condoms are often subjective and therefore difficult to measure (WHO, 2004).
It may be difficult and costly to obtain a full list of all possible sites where young people obtain condoms. For this reason, criteria should be developed for the types of venues to be included, focusing on venues that, in the particular national context, must consistently provide condoms for young people (WHO, 2004).
Where condom promotion activities center around marketing condoms at subsidized prices to people likely engaging in risky sex (social marketing), sales of particular brands of condoms can also provide a useful indicator of program success. Organizations responsible for the social marketing of condoms typically keep records of condoms distributed down to the retail level. Although these data tell only part of the story of condom availability, they provide a very low-cost source of information.
References: WHO, 2004. National AIDS programmes : a guide to indicators for monitoring and evaluating national HIV/AIDS prevention programmes for young people.
Number / percent of organization / program units systematically using information to plan and monitor performance
Definition: The capacity of managers to use routine information systems to monitor performance.
An effective management information system (MIS) processes raw data and produces information that allows decision-makers to understand how well the organization or program is performing. This indicator can apply to information systems designed for producing information to monitor the overall or "bottom-line" performance of the organization/program or the performance of individual management units such as finance or human resources.
Organization/program units in the context of reproductive health refer to either service delivery points, branch offices, or management units/departments within headquarters.
As a percentage, this indicator is calculated as:
(Number of organization/program units systematically using information to plan and monitor performance / total number of organization/program units using information systems) x 100
Data Requirements: Written (or computer generated) evidence of use of data (e.g. indicator charts, graphs); information system reports; planning objectives; number of units that show evidence of use of data; and total number of units.
Data Sources: Assessment of the MIS, conducted during routine supervision or by an external evaluator; interviews with key staff.
Purpose: When calculating this indicator, an evaluator examines the institutional documents specified above for the presence of the following three attributes of systematic monitoring:
- Data are converted into information on specified indicators of performance;
- Indicators are used to compare performance to objectives or standards established in operational and/or strategic plans; and
- Trend/time analysis of information is available in a way that is accessible to management (e.g., tables, graphs).
Applying this indicator is common in reproductive health programs to measure the use of routine service indicators. This set should include at least one indicator on each of the basic reproductive health services, such as family planning, antenatal and postnatal care, safe delivery services, STI/HIV treatment and prevention, as well as other programmatic indicators.
The indicator can also apply to a review of other information systems including disease surveillance systems, personnel or human resources, commodities and logistics, finance, and facilities and equipment.
Issue(s): This indicator assumes that the information available to the evaluator is both timely and accurate. The following two indicators in this section address these questions: Number/proportion of reporting units submitting a completed routine MIS report on time and Percent of data elements reported accurately in MIS reports. This indicator does not measure the effectiveness of decision-making based on information that is monitored. To do so would require a more complex, in-depth measurement process that involves interviews with key informants and intensive document review.
Completeness of reporting by facilities
Definition: Percent of facilities that submit reports within the required deadline.
Numerator: Number of facilities reporting monthly within a given time period.
Denominator: Total number of facilities.
Disaggregation: Facility type, geographic location, managing authority, programme.
Data Requirements: The number of reports received from facilities (usually monthly) is divided by the expected number of reports from facilities. Districts also report on a monthly or quarterly basis to national levels, and the received number of reports can be related to the expected number in order to assess completeness.
See also:Number/percent of reporting units submitting a completed routine management information systems report on time; and Percent of data elements reported accurately in MIS reports
Data Sources: Routine facility information systems
Purpose: This indicator contributes to the measurement of facility management performance, such as the existence and use of administrative systems to maintain and improve health service provision.
References: World Health Organization (WHO). 2015 Global Reference List of 100 Core Health Indicators.; 2015. http://apps.who.int/iris/bitstream/10665/173589/1/WHO_HIS_HSI_2015.3_eng.pdf
World Health Organization (WHO). Monitoring the Building Blocks of Health Systems: A Handbook of Indicators and Their Measurement Strategies.; 2010. http://www.who.int/healthinfo/systems/WHO_MBHSS_2010_full_web.pdf
Further information and related links
Monitoring the building blocks of health systems: a handbook of indicators and their measurement strategies. Geneva: World Health Organization; 2010 (Retrieved from http://www.who.int/healthinfo/systems/WHO_MBHSS_2010_full_web.pdf?ua=1).
Standard foreign assistance indicators/standard foreign assistance master indicator list (MIL). Washington (DC): United States Agency for International Development (Retrieved from http://www.state.gov/f/indicators/index.htm).
Maternal death reviews
Definition: Percent of maternal deaths occurring in the facility that were audited.
Numerator: Number of maternal deaths occurring in a health facility that were reviewed.
Denominator: Total number of maternal death in facilities.
Disaggregation: Community deaths, facilities, major administrative regions.
Data Requirements: Need for a clear definition of what qualifies as a “review”. This may or may not include actions taken, if these can be measured objectively.
See also: Percent of facilities that conduct case review/audits into maternal death/near miss
Data Sources: Specific monitoring with routine facility information systems
Hospital records and audit reports
Purpose: This indicator contributes to the measurement of facility management performance, such as the existence and use of administrative systems to maintain and improve health service provision.
References: World Health Organization (WHO). Consultation on Improving Measurement of the Quality of Maternal, Newborn and Child Care in Health Facilities.; 2013. http://apps.who.int/iris/bitstream/10665/128206/1/9789241507417_eng.pdf
World Health Organization (WHO). 2015 Global Reference List of 100 Core Health Indicators.; 2015. http://apps.who.int/iris/bitstream/10665/173589/1/WHO_HIS_HSI_2015.3_eng.pdf
Further information and related links
Consultation on Improving measurement of the quality of maternal, newborn and child care in health facilities. Geneva: World Health Organization/Partnership for Maternal, Newborn and Child Health; 2013.
Keeping promises, measuring results. Commission on information and accountability for Women’s and Children’s Health. Geneva: World Health Organization; 2011 (Retrieved from http://www.who.int/topics/millennium_development_goals/accountability_commission/Commission_Report_advance_copy.pdf).
Neonatal death reviews
Definition: Percent of neonatal deaths occurring in the facility that were audited.
Numerator: Number of neonatal deaths occurring in a facility that were reviewed.
Denominator: Total number of neonatal deaths in facilities.
Disaggregation: Community deaths, facilities, major administrative regions.
Hospital records, and audit reports.
Also: perinatal death reviews
Data Requirements: Need for a clear definition of what qualifies as a “review”. This may or may not include actions taken, if these can be measured objectively.
Data Sources: Specific monitoring with routine facility information systems
Purpose: This indicator contributes to the measurement of facility management performance, such as the existence and use of administrative systems to maintain and improve health service provision.
References: World Health Organization (WHO). Consultation on Improving Measurement of the Quality of Maternal, Newborn and Child Care in Health Facilities.; 2013. http://apps.who.int/iris/bitstream/10665/128206/1/9789241507417_eng.pdf
World Health Organization (WHO). 2015 Global Reference List of 100 Core Health Indicators.; 2015. http://apps.who.int/iris/bitstream/10665/173589/1/WHO_HIS_HSI_2015.3_eng.pdf
Further information and related links
Consultation on Improving measurement of the quality of maternal, newborn and child care in health facilities. Geneva: World Health Organization/Partnership for Maternal, Newborn and Child Health; 2013.
Keeping promises, measuring results. Commission on information and accountability for Women’s and Children’s Health. Geneva: World Health Organization; 2011 (Retrieved from http://www.who.int/topics/millennium_development_goals/accountability_commission/Commission_Report_advance_copy.pdf).
Number of trainees by type of personnel and topic of training
Definition: "Trainee" refers to any type of participant, student, or learner in a training event, regardless of its duration. "Type" refers to the different categories of participants (e.g., physicians, nurses, social workers). "Topic" is the subject matter covered (e.g., IUD insertion, universal precautions for HIV/ AIDS prevention, use of a partograph during delivery, etc.).
Data Requirements: Number of persons (based on an actual list of names for potential verification purposes), their professional positions, and topic of training
If targeting and/or linking to inequity, classify trainees by areas served (poor/not poor) and disaggregate by area served.
Data Sources: Records, usually kept by the training division, which are used both for administrative purposes during the training (e.g., distributing per diem) and for monitoring trainees at a later date
Purpose: This indicator serves as a crude measure of activity. Evaluators can use it for determining whether a program/project meets its target and/or for tracking progress from one year to the next.
Issue(s): The "unit of measurement" is not strictly speaking uniform, in that one trainee may have attended a course for one day, whereas another may have participated in a course for three months.
Evaluators can further improve the measure in several ways:
- Expressing the number of trainees by type of training;
- Expressing the number of trainees as the percent of the number scheduled for training in a given year;
- Expressing the number of trainees as a percent of the estimated number needed to be trained to fill a national program mandate, determined through a systematic needs assessment prior to the initiation of training activities; and
- Expressing the number successfully completing the course as a percent of the total that enroll in the course.
Because this indicator does not assess improved knowledge and/or skills, it should be used in conjunction with the indicators, Number Of Trainees By Type Of Personnel And Topic Of Training and Number/Percent Of Trainees Who Have Mastered Relevant Knowledge, as appropriate.
Gender Implications: A gender perspective on training assesses the following questions:
- How are the curricula developed?
- Are women and men involved in determining what subjects will be covered?
- Are women and men involved in drafting the contents?
- What is the content of the curricula?
- Is the language gender-sensitive?
- Are the contents in line with ICPD principles on sexual and reproductive rights?
- Do the contents cover gender-based differences in access to and use of health services?
- Who carries out the training?
- What proportion of the trainers are men? Women?
- What are the roles of male versus female trainers?
- What training methodologies are used?
- Are both men and women encouraged to speak-up during training? How often do men speak up? How often do women?
- What is done to help women participants overcome their shyness/intimidation in groups also containing men? This question is especially important in societies where mixed groups are uncommon.
- Who receives the training?
- What proportion of the trainees are men? Women?
- Are the training sessions held at times and places convenient for both women and men participants, given gender-based constraints, such as restricted mobility, lack of access to money for transport, and household/childcare responsibilities?
- Is there an equity plan to ensure that all employees get access to training?
- Is this plan enforced?
Number / percent of health workers trained to provide adolescent and youth-friendly services
Definition: The percent of program staff specifically trained to work with or provide information, education, or family planning services to adolescents
This indicator is calculated as:
(# of program staff who have received specific training to provide education/ counseling or adolescent health care /Total # of program staff working with adolescents) x 100
Data Requirements: Number of program staff working with adolescents, number (of these) who received specific training to provide education/ counseling or adolescent health care.
If targeting and/or linking to inequity, classify trainees by areas served (poor/not poor) and disaggregate by area served.
Data Sources: Program personnel files/records
Purpose: Working with youth requires perspectives and skills often lacking in standard pre-service training. This indicator measures the extent to which program personnel working with adolescents have received specific training to provide services to adolescents. Services may include outreach, information, education, counseling, referral, and reproductive health services.
Issue(s): This indicator only measures staff exposure to training; it does not measure the quality of the training or the staff competence in working with adolescents as a result of the training. A follow-up indicator could be Number/percent of trainees who have mastered relevant knowledge (found in the Training section of this database).
Distribution of health workers, by occupation / specialization, region, place of work and sex
Definition: The distribution or percent of health workers according to selected characteristics, notably by occupation, geographical region, place of work and sex.
Health workers are defined as all persons eligible to participate in the national health labor market by virtue of their training, accreditation, skills, and, where required, by age. The most complete and comparable data currently available on the health workforce globally pertain to physicians, nurses and midwives. However, the health workforce includes a wide range of other categories of service providers (e.g., dentists, pharmacists, physiotherapists, community health workers), as well as management and support workers. Information should be captured on all of these categories of human resources for health. Optimally, data on health occupations should be classified according to the latest International Standard Classification of Occupations (ISCO) revision or its national equivalent. For guidelines on using ISCO for classification of healthcare workers, see WHO (2011).
Where possible, geographic mapping of sites can be used to help determine coverage.
This indicator is calculated as:
(The number of health workers with a given characteristic / Total number of health workers in a designated area) x 100
This indicator is selected from the list of core indicators in the WHO Health System Strengthening (HSS) Handbook. For more background on the process and criteria used in developing the WHO Handbook of indicators for HSS and for details on this and related indicators, see WHO (2010) ; USAID (2009); and The Global Fund (2009).
Data Requirements: The HSS indicator for stock of health workers can be subset according to the selected characteristics (see indicator in this section Number of health workers per 10,000 population by type of health worker). Geographic locations of health facility sites using maps or computerized mapping system. The WHO service availability and readiness assessment (SARA) is specifically designed to assess, map and monitor service availability and readiness, including human resources. For more details on the SARA, see WHO (2010). Data can be disaggregated by occupation (and subset within a given occupation or medical specialization), by geographical typology (e.g. urban or rural, within or outside the capital city, by province/state or district), by place of work (e.g. hospital or primary health-care facility, public or private), by main work activities (e.g., preventive, curative, rehabilitative healthcare versus teaching or research), and by sex.
Data Sources: Health facility records; human resource information system (HRIS); database maintained by the ministry of health or other mandated agency; maps and/or computerized mapping systems; facility surveys, such as the SARA
Purpose: This indicator provides information on the distribution of health workers by their occupations and areas of specialty and can be subset by district, sex, age and other categories to examine coverage and demographics of the health care workforce. The additional information on health workers’ demographic characteristics may be important for policy and planning, for instance, the age distribution can lend insights into the numbers of workers approaching retirement age and whether sufficient numbers of younger health workers are coming into the system. At least four main typologies for monitoring the distribution of health workers should be considered: imbalances in occupation/specialty; geographical representation; institutions and services; and demographics. The impact on the health system varies for these different types of imbalances and, consequently, there is a need to monitor and assess each of these dimensions of workforce distribution (WHO, 2010).
Issue(s): Counts of workers outside the public sector (i.e., private, non-governmental, community-based) are likely to be less accurate, particularly if these sectors are not required to register and/or provide reports on staff and services. Private sector providers are often less accessible to low-income populations, compared with public and community- based providers making it important to disaggregate this indicator by employment sector. While this indicator measures the availability and distribution of service providers by occupations and other categories, it does not take into account all of a health system's objectives, particularly with regard to accessibility, equity, efficiency, and quality of training and services.
Poverty and Equity Considerations: Globally, there is increasing attention to equity in health and the pathways by which inequities arise and are perpetuated or exacerbated. Imbalance or uneven distribution in the supply, deployment and composition of human resources for health can lead to inequities in the effective provision of health services and is an issue of social and political concern in many countries. Attaining and maintaining sufficient numbers and distribution of well-trained health workers by occupations and specialties is basic to HSS and contributes to achieving progress in the Millennium Development Goals for health #4. Reduce child mortality; #5. improve maternal health; and #6. combat HIV/AIDS.
References: The Global Fund, 2009, Monitoring and Evaluation Toolkit: HIV, Tuberculosis and Malaria and Health Systems Strengthening. http://rbm.who.int/toolbox/tool_MEtoolkit.html
USAID, 2009, Measuring the Impact of Health Systems Strengthening, A Review of the Literature, Washington, DC: USAID. http://www.usaid.gov/our_work/global_health/hs/publications/impact_hss.pdf
WHO, 2010, Monitoring the building blocks of health systems: a handbook of indicators and their measurement strategies, Geneva: WHO. http://www.who.int/healthinfo/systems/WHO_MBHSS_2010_full_web.pdf
WHO, 2011, Classifying health workers: Mapping occupations to the international standard classification, Geneva: WHO. http://www.who.int/hrh/statistics/Health_workers_classification.pdf
Health worker absenteeism
Definition: Number of days of health worker absenteeism relative to the total number of scheduled working days over a given period among staff at primary health-care facilities
Numerator: Number of days of health worker absenteeism.
Denominator: Total number of scheduled working days over a given period among staff at primary health-care facilities
Data Sources: Ideally assessed though facility staffing/payroll records; can also be assessed by means of special study cross-examining duty roster lists with actual head-counts on the day of visit.
Purpose: This indicator is useful for monitoring human resources dynamics and their potential means of verification. Disaggregation allows for monitoring progress in actions to improve equity in access and coverage of essential health interventions, especially among underserved communities or other nationally prioritized population groups.
References: World Health Organization (WHO). Monitoring the Building Blocks of Health Systems: A Handbook of Indicators and Their Measurement Strategies.; 2010. http://www.who.int/healthinfo/systems/WHO_MBHSS_2010_full_web.pdf
Health worker supervision
Definition: Percent of health service providers at primary health-care facilities who received personal supervision in the past six months
Numerator: Number of health service providers at primary health-care facilities who received personal supervision in the past six months
Denominator: Total number of health service providers
Data Requirements: See also: Percent of employees who have completed their annual performance reviews with their supervisors for the last performance period
Data Sources: Ideally assessed through a sample survey of health workers; also can be assessed via facility administrative records.
Purpose: This indicator contributes to the measurement of facility management performance, such as the existence and use of administrative systems to maintain and improve health service provision.
References: World Health Organization (WHO). Monitoring the Building Blocks of Health Systems: A Handbook of Indicators and Their Measurement Strategies.; 2010. http://www.who.int/healthinfo/systems/WHO_MBHSS_2010_full_web.pdf
Health facility leadership style
Definition: The type of leadership style exerted by the health facility manager.
Numerator: The health facility leadership style is assessed using F1 section 10 of the Health Facility Questionnaire developed by the World Bank (see below).
To determine the leadership style of the health facility, use the health facility survey to assign points to each of three leadership styles (i.e. collaborative, autocratic or laissez-faire). Leadership style is the one that has most points.
To calculate the number of points for collaborative leadership style: assign 1 point each if 10.1=3, 10.02=1, 10.03=1, 10.04=1, 10.05=1.
To calculate the number of points for Autocratic leadership style: assign 1 point each if 10.1=1 or 4, 1 point each if 10.02=3, 10.03=2, 10.04=3, 10.05=3; half point each if 10.03=4 , 10.04=2;
To calculate the number of points for laissez-faire leadership style: assign 1 point each if 10.01=2, 10.02=4, 10.03=3, 10.04=4, 10.05=4.
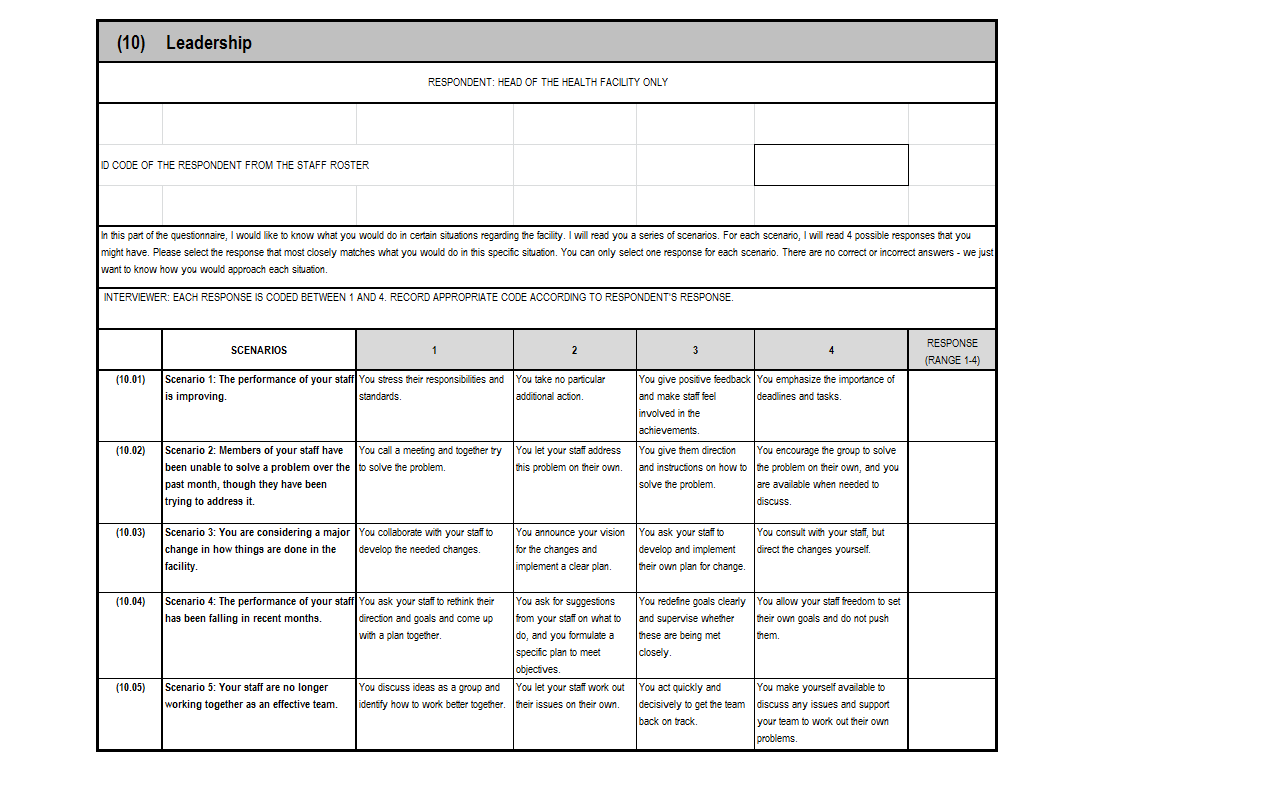
Data Requirements: Health facility leadership style is assessed using the Heath Results Based Financing Impact Evaluation, F1 section 10 - Health Facility Assessment Questionnaire (developed by the World Bank).
The health facility questionnaires were designed to provide primary data on service delivery, facility structures, process quality, human resources and infrastructure. A health facility survey involves visiting and collecting data for all health facilities identified in the sampling plan.
Data Sources: World Bank health facility survey: Heath Results Based Financing Impact Evaluation, Health Facility Questionnaire: F1 - Health Facility Assessment Questionnaire (Section 10 - Leadership).
Purpose: Leadership styles refer to how leaders express specific behaviors. This indicator aims to categorize the leadership style of the health facility as either collaborative, autocratic or laissez-faire, in an effort to explore a range of directive and supportive behaviors.
The autocratic leadership style allows managers to make decisions alone without the input of others while a laissez-faire leader exhibits little direct supervision of employees and fails to provide regular feedback to those under his/her supervision. The collaborative leadership style is democratic, valuing the input of team members and peers and allowing employees to make contributions to the decision-making process.
References: Vermeersch C, Rothenbühler E, Sturdy JR. Impact Evaluation Toolkit Measuring the Impact of Results-Based Financing on Maternal and Child Health.; 2012.
Wendt, H., Euwema, M. C., & van Emmerik, I. H. (2009). Leadership and team cohesiveness across cultures. The Leadership Quarterly, 20(3), 358-370.
The complete toolkit and health facility survey can be found on the World Bank website at: http://web.worldbank.org/WBSITE/EXTERNAL/TOPICS/EXTHEALTHNUTRITIONANDPOPULATION/EXTHSD/EXTIMPEVALTK/0,,contentMDK:23262154~pagePK:64168427~piPK:64168435~theSitePK:8811876,00.html
Autonomy of the health facility
Definition: The degree of autonomy over decision-making at the health facility level.
Numerator: Autonomy of the health facility is assessed using F1 section 11 of the Health Facility Questionnaire developed by the World Bank (see below).
To determine the level of health facility autonomy, assign one point each for question (i.e. question 11.01 through 11.09), add up all points and divide by 9 to obtain a percentage.
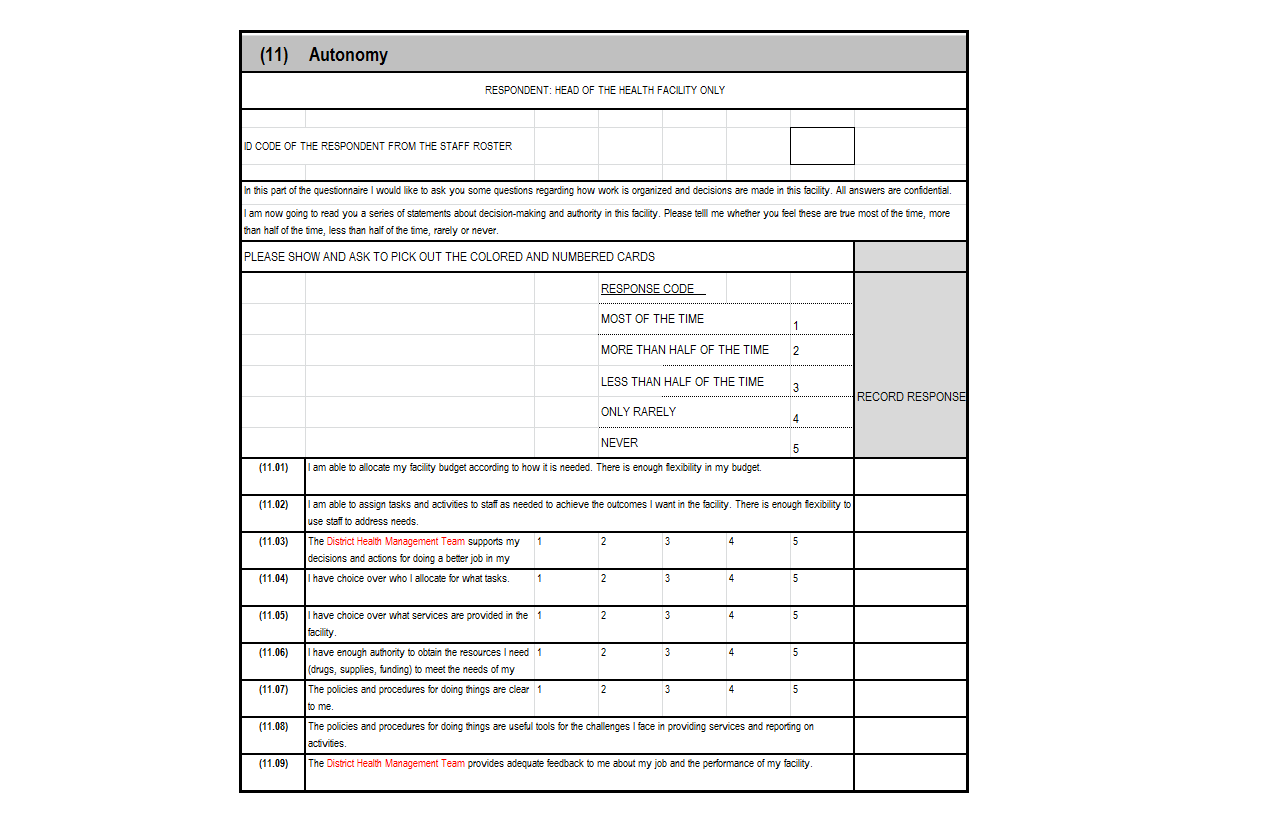
Data Requirements: Autonomy of the health facility is assessed using the Heath Results Based Financing Impact Evaluation, F1 section 11 - Health Facility Assessment Questionnaire (developed by the World Bank).
The health facility questionnaires were designed to provide primary data on service delivery, facility structures, process quality, human resources and infrastructure. A health facility survey involves visiting and collecting data for all health facilities identified in the sampling plan.
Data Sources: World Bank health facility survey: Heath Results Based Financing Impact Evaluation, Health Facility Questionnaire: F1 - Health Facility Assessment Questionnaire (Section 11 - Autonomy).
Purpose: The principle of autonomy is central to results-based financing (RBF) for health; increasing health facility (management) autonomy is vital to RBF success. RBF is not merely a matter of changing funding mechanisms. It is about holding people responsible for the results they obtain, making sure that providers are autonomous in decision-making at the operational level and ensuring that providers are accountable to clients.
Autonomy is needed to allow health service providers and their partners to come to context-specific approaches for results. In order to increase the quantity and quality of health services, health facilities need the autonomy, flexibility and freedom to manage resources effectively via creative and innovative means. To date, the most important strategy in RBF to foster autonomy is linked to the setup of new structures and implementation of approaches such as decentralization, devolution and community involvement.
This indicator provides an estimate of the overall quantity of autonomy as experienced by the health facility leader.
References: Vermeersch C, Rothenbühler E, Sturdy JR. Impact Evaluation Toolkit Measuring the Impact of Results-Based Financing on Maternal and Child Health.; 2012.
Toonen J, Canavan A, Vergeer P, Elovainio R. Learning Lessons on Implementing Performance Based Financing, from a Multi-Country Evaluation. Amsterdam: KIT (Royal Tropical Institute); 2009. http://www.who.int/contracting/PBF.pdf.
Fritsche GB, Soeters R, Meessen B. Performance-Based Financing Toolkit.; 2014. doi:10.1596/978-1-4648-0128-0.
The complete toolkit and health facility survey can be found on the World Bank website at: http://web.worldbank.org/WBSITE/EXTERNAL/TOPICS/EXTHEALTHNUTRITIONANDPOPULATION/EXTHSD/EXTIMPEVALTK/0,,contentMDK:23262154~pagePK:64168427~piPK:64168435~theSitePK:8811876,00.html
WHO well-being index for health workers
Definition: Rapid estimate of human well-being.
Numerator: The WHO well-being index for health workers can be assessed using F2 section 8 of the Health Facility Questionnaire, developed by the World Bank (see below).
For each component in the index, compute 4 minus the response code for all questions (i.e. 8.01, 8.02, 8.03, 8.04, 8.05) and determine the total for all components of the index. Then divide the total by the number of elements in the index (i.e. 5).
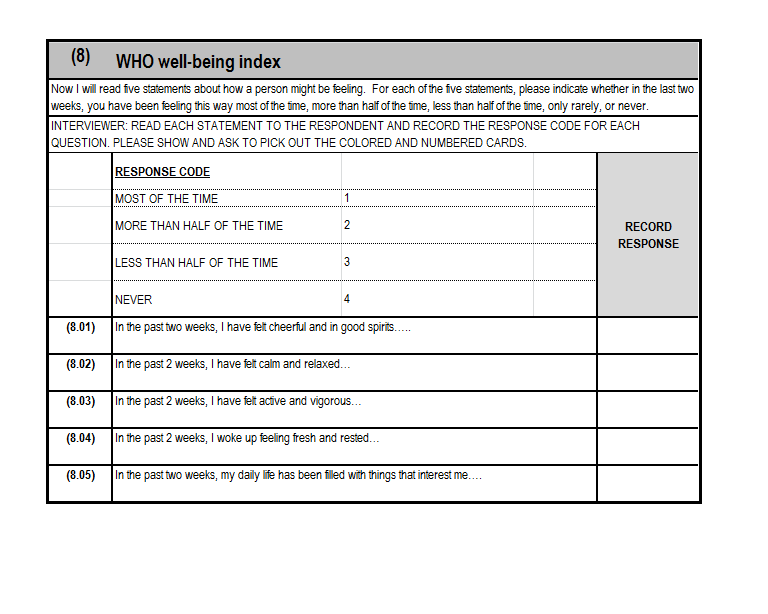
Data Requirements: The WHO well-being index for health workers is assessed using the Heath Results Based Financing Impact Evaluation, F2 section 8 - Health Worker Individual Questionnaire (developed by the World Bank).
The health facility questionnaires were designed to provide primary data on service delivery, facility structures, process quality, human resources and infrastructure. A health facility survey involves visiting and collecting data for all health facilities identified in the sampling plan.
Data Sources: World Bank health facility survey: Heath Results Based Financing Impact Evaluation, Health Facility Questionnaire: F2 - Health Worker Individual Questionnaire (Section 8 - Wellbeing).
Purpose: The World Health Organization (WHO) defines health as “a state of complete physical, mental and social well-being and not merely the absence of disease or infirmity”. Further, the workplace has been established as one the priority settings for health promotion, with occupational health evolving to include not only the physical work environment but psychosocial and personal health factors as well. To this end, a healthy workplace has been defined as one in which workers and managers collaborate to use a continual improvement process to protect and promote the health, safety and well-being of all workers and the sustainability of the workplace. This indicator provides a rapid estimate of human well-being, with the index ranging from 0 (low well being) to 1 (high well being).
References: Vermeersch C, Rothenbühler E, Sturdy JR. Impact Evaluation Toolkit Measuring the Impact of Results-Based Financing on Maternal and Child Health.; 2012.
Hospital bed density
Definition: Total number of hospital beds per 10 000 population.
Numerator: Number of hospital beds (excluding labour and delivery beds).
Denominator: Total population.
Disaggregation: Distribution (by province/district), ownership (public/private), type of bed.
Data Requirements: A national database is usually maintained. Regular updates through surveys or facility censuses are needed.
See also: Number and distribution of inpatient beds per 10,000 population
Data Sources: Routine facility information systems/national database
Health facility census
Purpose: The indicator contributes to the measurement of facility infrastructure management, such as physical availability and accessibility of health services.
References: World Health Organization (WHO). 2015 Global Reference List of 100 Core Health Indicators.; 2015. http://apps.who.int/iris/bitstream/10665/173589/1/WHO_HIS_HSI_2015.3_eng.pdf
World Health Organization. Monitoring, Evaluation, and Review of National Health Strategies: A Country-Led Platform for Information and Accountability.; 2011. http://www.who.int/healthinfo/country_monitoring_evaluation/1085_IER_131011_web.pdf
Further information and related links
Monitoring the building blocks of health systems: a handbook of indicators and their measurement strategies. Geneva: World Health Organization; 2010 (http://www.who.int/healthinfo/systems/WHO_MBHSS_2010_full_web.pdf?ua=1).
World health statistics 2014. Geneva: World Health Organization; 2014 (http://apps.who.int/iris/bitstream/10665/112738/1/9789240692671_eng.pdf?ua=1).
Health service access
Definition: Percent of population living within 5 km of a health facility (total number of health facilities per 10 000 population).
Numerator: Number of facilities in public and private sectors.
Denominator: Total population.
Disaggregation: Access to emergency surgery (% of the population that can access, within 2 hours, a facility that can perform emergency caesarean section, laparotomy and open fracture fixation), density of specific services, facility ownership, location (district, province, national), type.
Data Requirements: Availability (health facility assessment, census, master facility list).
Geographical accessibility is the preferred indicator and is often measured by distance or travel time to a static health facility. A more objective and easier indicator uses facility databases to assess density and distribution.
See also: Percent of population living within two hours travel time from nearest facility offering a specific reproductive health service; and Number and distribution of health facilities per 10,000 population
Data Sources: Facility database
Geospatial modelling
Surveys
Purpose: The indicator contributes to the measurement of facility infrastructure management, such as physical availability and accessibility of health services.
References: World Health Organization (WHO). 2015 Global Reference List of 100 Core Health Indicators.; 2015. http://apps.who.int/iris/bitstream/10665/173589/1/WHO_HIS_HSI_2015.3_eng.pdf
World Health Organization. Monitoring, Evaluation, and Review of National Health Strategies: A Country-Led Platform for Information and Accountability.; 2011. http://www.who.int/healthinfo/country_monitoring_evaluation/1085_IER_131011_web.pdf
Further information and related links
Monitoring the building blocks of health systems: a handbook of indicators and their measurement strategies. Geneva: World Health Organization; 2010 (Retrieved from http://www.who.int/healthinfo/systems/WHO_MBHSS_2010_full_web.pdf?ua=1).
World health statistics 2014. Geneva: World Health Organization; 2014 (Retrieved from http://apps.who.int/iris/bitstream/10665/112738/1/9789240692671_eng.pdf?ua=1)